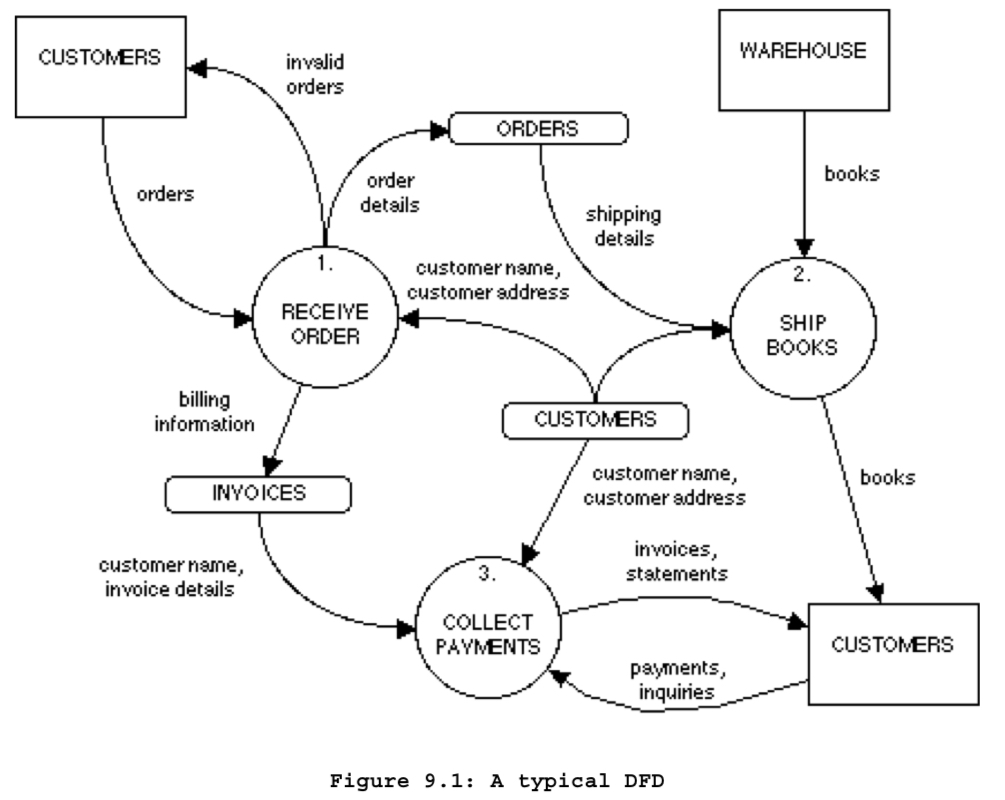
Data Flow Diagrams represent data flows in a graphical way. There is no single governing body or ”official” specification that DFD Diagrams “shall” adhere to. They evolved out of the same ”SADT” effort that eventually led to IDEF0, and this share a lot of commonalities.

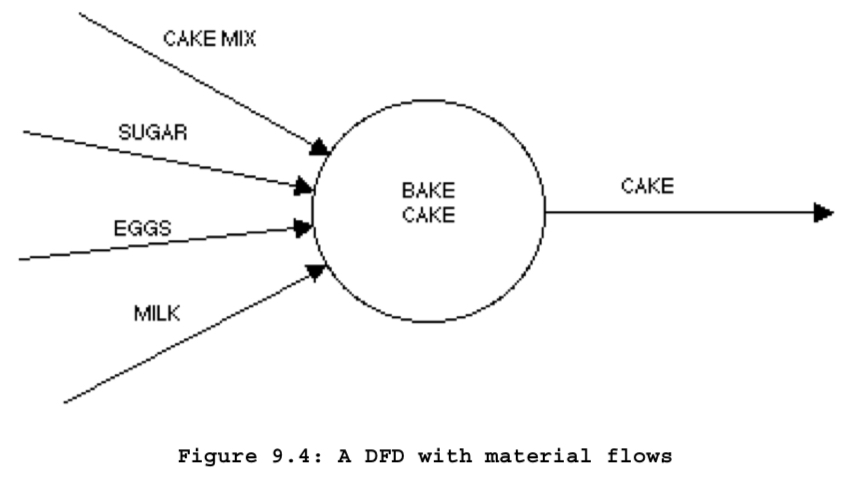
Several example diagrams I’ve found document more than just “data”:
 …which basically just turns a DFD Diagram into OPM or IDEF3.
There are apparently 2-to-4 main competing syntaxes.
Features
- Like IDEF0…
- they are essentially self-explanatory
- they are meant to be small & simple, achieved through decomposition and hierarchy
- Including a top-level “Level 0” diagram, aka “Context Diagram”
- Don’t include mechanisms for control flow & boolean logic
- It can represent situation-dependent flows, though. A function’s may have two outputs ”
valid phone number” and ”invalid phone number”, for example.
- It can represent situation-dependent flows, though. A function’s may have two outputs ”
- Elements in the diagram are uniquely numbered
- Components1
- Data flows - arrows
- Processes - circles
- Data Stores/Entities - rounded rectangles
- From a Systems Thinking perspective, these are ”stocks”
- There’s an implied semantic meaning for including a “store” instead of just using data flows to connect processes directly to each other, if a store is present, that means it exists in some enduring form. It also means the functions write to/read from the store, as opposed to talking directly to one-another.
- Terminators/External Entities - rectangles
- Decomposition Understanding
Complimentary Practices
Just Enough Structured Analysis suggests DFD Diagrams are necessary but not sufficient for representing system behavior. It suggests the need to combine DFD Diagrams with Data Dictionaries and Process Specifications2.