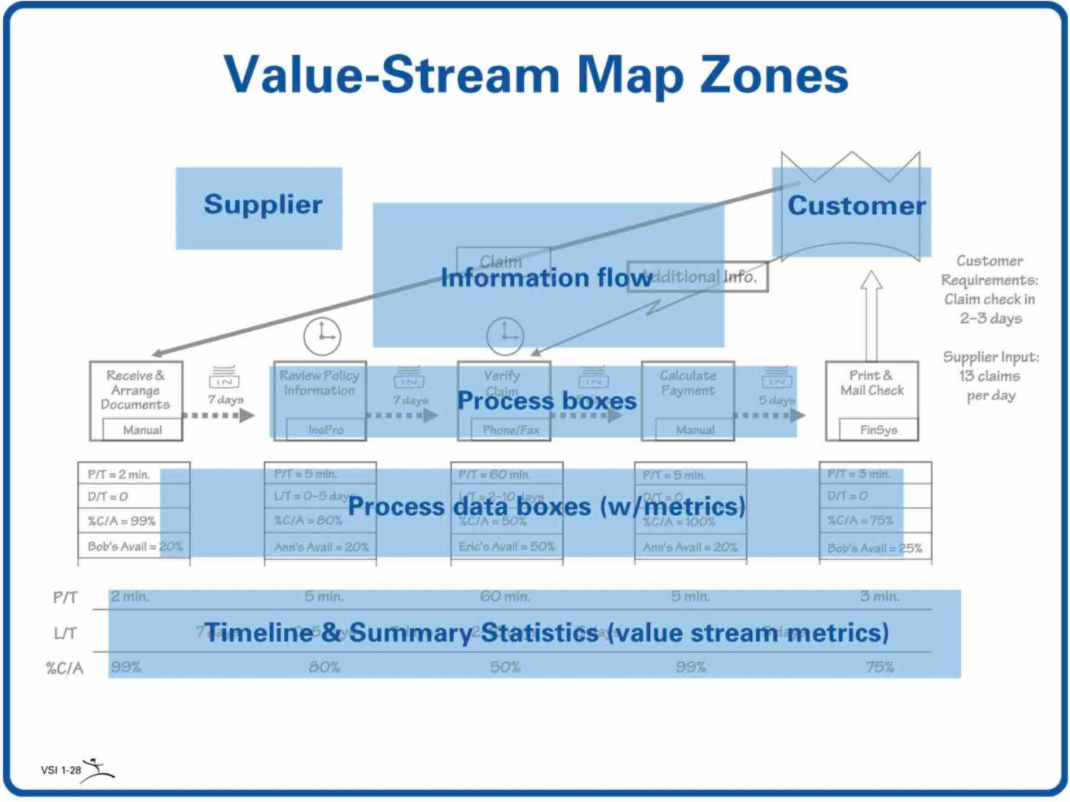
Value Stream Mapping is a Visual Analysis Technique to view how Business Value is (or is not) produced throughout the lifecycle of a process that takes time, to identify Waste and bottlenecking factors. It’s slightly more structured than I was expecting, going in. It is built using layers (whose nature seems to vary slightly from source-to-source) and oriented about a timeline, like Sequence Diagrams turned on their side with swim lanes for information, processes, and value-production (as measured in Metrics):

Layers
Information Flow
Signals that affect system behavior. What kicks off the system. Status messages generated.
Material Flows
Processes that happen. The material that flows between them. Including process metadata, like ”Takt Time”, success rate, etc.
Timeline
The bottom of all the Value Stream Maps I’ve seen are where the actual value stream is.
Source
- Wikipedia
- lean.org